
Transforming Raw Data into Actionable Insights for Business
Data analytics is more than just crunching numbers—it’s about extracting meaningful insights from raw data to drive strategic decision-making and business outcomes. Our data analytics experts employ a comprehensive approach to data analysis, leveraging advanced techniques and technologies to extract, transform, and analyze data from various sources, including structured and unstructured data, IoT devices, social media, and more.
- Comprehensive Data Analysis
- Predictive Analytics
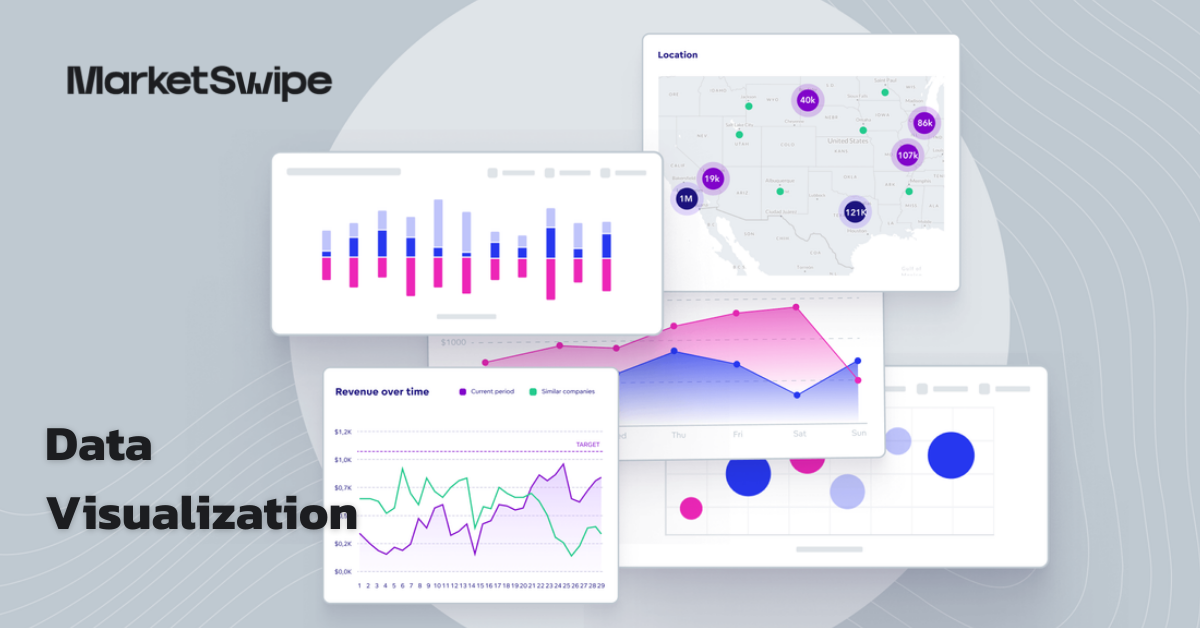
- Data Visualization
- Business Intelligence
MarketSwipe
How Data Analytics Can Help Drive Business Growth

Unlock the Power of Your Data
With advanced data analytics solutions, organizations can uncover valuable insights, optimize processes, and drive informed decision-making, fueling business growth and success.
Business intelligence (BI) solutions provide organizations with the tools and capabilities to analyze and interpret data, monitor performance, and generate actionable insights in real-time. Our BI experts specialize in implementing and customizing BI solutions tailored to your specific business needs, enabling stakeholders at all levels to access timely and relevant information, make data-driven decisions, and drive business success.
Trust in Our Data Analysts
Our team of data analytics experts has the expertise to unlock the full potential of your data. From data collection and processing to analysis and visualization, we’ll work closely with you to uncover actionable insights that drive business value and competitive advantage.

what you get
What is included in our data analytics services?
When you partner with MarketSwipe, you’ll gain access to our full range of digital services.
These services are designed to optimize every facet of your business
and Integration
and Modeling
and Reporting
and Integration
Data Collection and Integration
Collect and integrate data from various sources, including databases, applications, IoT devices, and more.
and Modeling
Data Analysis and Modeling
Analyze and model data to uncover patterns, trends, and insights that drive strategic decision-making.
and Reporting
Data Visualization and Reporting
Visualize data using interactive dashboards, reports, and visualizations that communicate insights effectively.
Creating Success
What Makes Our Data Analytics Service Effective?
Comprehensive Approach
We employ a comprehensive approach to data analytics, leveraging advanced techniques and technologies to extract, transform, and analyze data from diverse sources.
Predictive Analytics
We harness the power of predictive modeling, machine learning, and AI to anticipate trends, behaviors, and opportunities, enabling proactive decision-making and competitive advantage.
Data Visualization
We create intuitive and interactive visualizations, dashboards, and reports that transform raw data into compelling stories, enabling stakeholders to gain actionable insights and drive data-driven decision-making.
“MarketSwipe’s digital services are light years ahead of the competition because of their visionary, specialized and expert professionals.”
Director of Kisani

The proof is in the numbers
Why Data Analytics Brings in the Numbers
48%
Increase in Revenue: Data analytics empowers organizations to identify revenue opportunities, optimize pricing strategies, and target high-value customers more effectively.
52%
Improvement in Operational Efficiency: By analyzing and optimizing processes, data analytics helps organizations streamline operations, reduce costs, and improve productivity.
84%
Increase in Customer Satisfaction: Data-driven insights enable organizations to better understand customer needs, preferences, and behavior, leading to personalized experiences, improved products, and higher customer satisfaction.
FAQ
FAQs about Data Analytics
Looking to learn more about data analytics for your business? Browse our FAQs:
Data analytics is the process of collecting, processing, analyzing, and interpreting data to uncover valuable insights and patterns that drive informed decision-making and business growth. In today’s data-driven world, data analytics is essential for organizations looking to optimize processes, improve performance, and gain a competitive edge by leveraging the power of data.
Data analytics can be applied to various types of data, including structured data (e.g., databases, spreadsheets), unstructured data (e.g., text, images, videos), and semi-structured data (e.g., XML, JSON). Organizations can analyze internal data sources, such as sales records, customer transactions, and operational metrics, as well as external data sources, such as social media, market research, and IoT devices, to gain valuable insights into their business operations and market dynamics.
Predictive analytics enables businesses to forecast future trends, behaviors, and events based on historical data and statistical algorithms. Some benefits of predictive analytics include:
- Anticipating customer needs and preferences
- Identifying potential risks and opportunities
- Optimizing resource allocation and decision-making
- Improving operational efficiency and profitability
Data visualization is a crucial component of data analytics, as it enables organizations to communicate complex insights and trends effectively. By transforming raw data into intuitive and interactive visualizations, organizations can:
- Identify patterns, trends, and outliers more easily
- Gain a deeper understanding of data relationships and correlations
- Communicate insights and findings to stakeholders more effectively
- Drive data-driven decision-making and action across the organization
Implementing a data analytics solution involves several key steps, including:
- Data collection and integration: Collecting data from various sources and integrating it into a centralized repository.
- Data processing and cleaning: Preparing and cleaning the data to ensure accuracy and consistency.
- Data analysis and modeling: Analyzing the data to uncover insights and trends using statistical techniques and machine learning algorithms.
- Data visualization and reporting: Communicating the findings through interactive visualizations, dashboards, and reports.
Data security and privacy are critical considerations in data analytics, and organizations must implement appropriate measures to protect sensitive information and comply with data protection regulations. Some best practices for ensuring data security and privacy include:
- Implementing robust access controls and encryption mechanisms
- Conducting regular security audits and risk assessments
- Adhering to data governance and compliance standards
- Providing employee training and awareness programs on data security and privacy protocols
Get Started!
- 30-min strategy call
- In-depth audit
- Growth Roadmap

Data Collection
Various Data SourcesUS$800 US$500/One-Time
Data Analysis
Data ModelingUS$800 US$500/One-Time
Data Visualization
ReportingUS$1500 US$1000/One-Time
Need To Add Something?
Make A Service Request!
Are we missing out on something to help you grow your business?
Do you want to earn money with our data-centric, performance-driven innovative digital solutions?
Earn 10% by promoting our solutions
Join our affiliate program and enjoy 10% commission on every solution that converts on MarketSwipe
Become An Affiliate and Start Earning Today!


- Get Paid On PayPal